
Top 10 Furniture Countries for Global Sourcing?
Choosing the right furniture country can shape product quality, landed cost, delivery speed, and brand reputation. This guide examines ten leading destinations for global furniture sourcing. It looks beyond low factory prices.
A sourcing map becomes useful when it reflects real buying decisions. Can the supplier produce kiln-dried oak consistently? Can its factory meet a 500-unit order without changing the finish? Are packing methods strong enough for a long sea journey? These details often matter more than a country’s reputation.
Furniture designer and industry authority George Nelson said, “Everything is designed. Few things are designed well.” His observation applies directly to international sourcing. A beautiful sample means little if the production line creates uneven joints, weak drawer runners, or damaged corners.
The ranking considers manufacturing capability, material access, export infrastructure, design expertise, labor practices, and supplier communication. It also recognizes uncertainty. Exchange rates change. Shipping routes shift. Factory performance can vary between regions, and even between seasons.
No furniture country wins every category. Vietnam may suit solid wood programs, while Italy may serve premium design-led collections. China can offer enormous supplier depth, but due diligence remains essential. Poland and Turkey may provide useful access to European markets and shorter delivery routes.
The strongest decision depends on your product, volume, budget, and risk tolerance. Not just price.
This introduction begins a practical comparison for importers, retailers, hospitality buyers, and private-label brands. It encourages verification through factory audits, sample testing, reference checks, and written specifications. A country can open the door. Reliable execution determines whether the order succeeds.
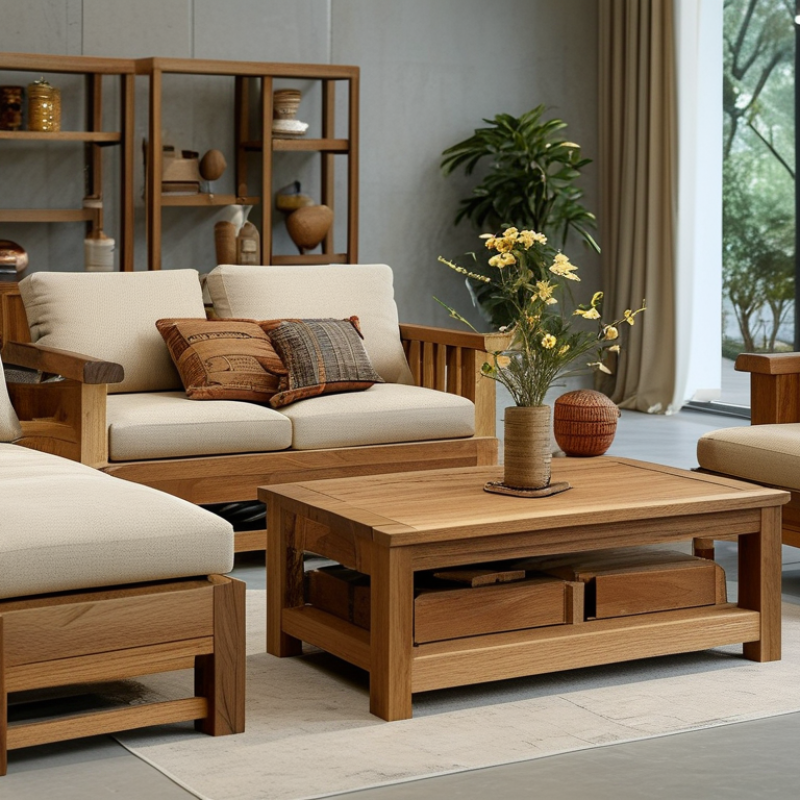
How Furniture Sourcing Countries Are Evaluated
How Furniture Sourcing Countries Are Evaluated
A sourcing country should be judged by evidence, not headlines. CSIL’s World Furniture Outlook 2024 places global furniture consumption above US$700 billion in 2023. That scale creates opportunity, but size alone proves little. UN Comtrade data under HS 9403 helps compare export value, product categories, and trade direction. Experienced buyers also inspect factories, material samples, moisture control, packaging, and corrective-action records.
Logistics deserves equal attention. The World Bank’s 2023 Logistics Performance Index assesses 139 economies across customs, infrastructure, shipments, and delivery reliability. A country with efficient ports may still face inland delays. Ask for lane-specific data. Check average lead times during peak seasons. Small details matter, such as pallet strength and carton drop-test results.
Labor capability is harder to measure. Skilled joinery, finishing consistency, and engineering support often separate a stable supplier from a cheap one. The International Labour Organization’s safety and labor standards provide a useful compliance reference. Environmental reviews should examine timber documentation, energy use, wastewater controls, and factory audits. These checks are not flawless. Audit dates can be outdated, and reported capacity may differ from actual output. A careful evaluation combines public data with site visits, third-party testing, sample orders, and transparent production records. Price still matters. It should never be the only score.
Top 10 Furniture Countries for Global Sourcing? - How Furniture Sourcing Countries Are Evaluated
A practical comparison based on export scale, manufacturing capability, cost position, quality, logistics, compliance readiness, and category coverage.
| Rank | Country | Indicative 2023 Furniture Exports (HS 94, USD billions) |
Manufacturing Scale |
Cost Competitiveness |
Product & Category Range |
Quality & Design Capability |
Logistics & Export Infrastructure |
Compliance & Market Readiness |
Best-Suited Categories |
Weighted Score / 100 |
Typical Sourcing Position |
|---|---|---|---|---|---|---|---|---|---|---|---|
| 1 | China | Approximately 76 | 5/5 | 4/5 | 5/5 | 4/5 | 5/5 | 4/5 | Case goods, upholstered furniture, outdoor furniture, office furniture, components | 91 | Broadest supplier base |
| 2 | Italy | Approximately 15 | 4/5 | 3/5 | 4/5 | 5/5 | 5/5 | 5/5 | Premium seating, kitchens, bedroom furniture, design-led and contract furniture | 88 | Design and premium quality |
| 3 | Poland | Approximately 15 | 4/5 | 4/5 | 4/5 | 4/5 | 5/5 | 5/5 | Flat-pack furniture, upholstered seating, case goods, mattresses and contract projects | 87 | Efficient European production |
| 4 | Germany | Approximately 14 | 4/5 | 2/5 | 4/5 | 5/5 | 5/5 | 5/5 | Office furniture, kitchens, ergonomic seating, engineered wood and technical furniture | 85 | Engineering and reliability |
| 5 | Vietnam | Approximately 11 | 4/5 | 4/5 | 4/5 | 4/5 | 4/5 | 4/5 | Wooden bedroom furniture, dining furniture, outdoor furniture and upholstered products | 82 | Strong Asia-Pacific alternative |
| 6 | United States | Approximately 8 | 4/5 | 2/5 | 5/5 | 4/5 | 5/5 | 5/5 | Custom furniture, office furniture, institutional furniture and short-lead-time products | 81 | Domestic and near-market supply |
| 7 | Türkiye | Approximately 6 | 4/5 | 4/5 | 4/5 | 4/5 | 4/5 | 4/5 | Upholstered furniture, mattresses, solid wood furniture and hospitality projects | 80 | Regional bridge market |
| 8 | Malaysia | Approximately 5 | 3/5 | 4/5 | 4/5 | 4/5 | 4/5 | 4/5 | Rubberwood furniture, dining sets, bedroom furniture and upholstered seating | 78 | Wood-product specialization |
| 9 | Canada | Approximately 4 | 3/5 | 2/5 | 4/5 | 4/5 | 5/5 | 5/5 | Wood furniture, office furniture, custom production and North American replenishment | 77 | Reliable North American source |
| 10 | India | Approximately 3 | 3/5 | 4/5 | 4/5 | 4/5 | 3/5 | 3/5 | Solid wood furniture, handicraft-based furniture, seating and made-to-order products | 74 | Craftsmanship and customization |
Data basis: Export figures are rounded indications compiled from 2023 international trade data for HS Chapter 94, which covers furniture, bedding, mattresses, lighting and related articles. Country scores are comparative sourcing assessments rather than official government ratings.
Evaluation method: The weighted score considers manufacturing scale, cost competitiveness, product range, quality and design, logistics, export infrastructure, compliance readiness, and suitability for international buyers. Actual results vary by product specification, order volume, certification requirements, shipping route, and production lead time.
Related Posts
-

Ultimate Guide to Choosing the Best Furniture Country Styles for Your Home Decor
-

How to Choose the Perfect Sofa Couch for Your Living Space
-
How to Choose the Best Handcrafted Furniture for Your Home?
-

Transform Your Space: The Benefits of Sustainable Wood Furniture for a Healthier Home
-

Innovative Solutions for Enhancing Your Living Space with Sofa Chairs
-
2026 Top Trends in Wooden Furniture You Need to Know?